Digital advertising and marketing: only the best ideas worldwide, since 2003
Tag archives: infographic
Design and Color Trends 2014
istock approached creatives from around the world and collected the strongest trends in colour and design: Pantone’s Color of the Year and Top 10 Hot or Not. Both are published as handy info graphics. Study them and you’ll surely be #winning at your next creative presentation.
Follow me @tbuesing
The best time of day to send emails [infographic]
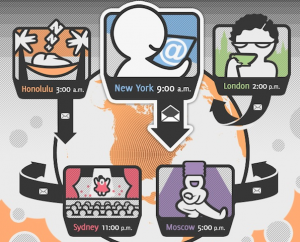
Email blasts may seem like the out-of-touch old fogey of online marketing, but there’s a reason they keep hanging around: They still work. But that doesn’t mean most businesses understand how to get the most out of them. One of the biggest, hardest-to-answer questions has always been: When is the best time to send out messages? Finally, we have some hard information. Read more…
The Evolution of Digital Advertising
How has the advertising industry evolved in the the last 30 years? Read more…
The War on Free Clicks
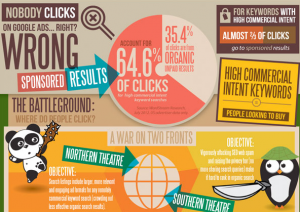
The infographic below from The Wordstream Blog is really interesting since it outlines the battle between paid advertising (PPC) versus free clicks (SEO). The infographic gives us insiders tips about which horse to bet on. via traffika.com.au
10 Things People Love and Hate About Pinterest
You either love, or you hate Pinterest, the visual social sharing site. Let’s not forget that this is the site that in its first month was the #1 source for referring web traffic (being Google+, Reddit and Linkedin combined). Is it going to be here today, gone tomorrow or will it become the next major force in social sharing? Read more…
Ad people vs Normal people [infographic]
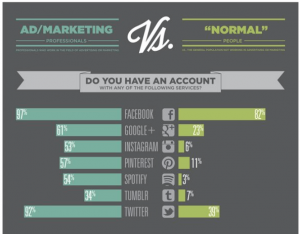
Ever wondered if we ad folk live in a bubble? This infographic explains it all. haha Read more…
The rise of the visual social network #infographic
Browsing around Pinterest today I’ve found via InsideFMM this infographic by John Lanigan which analyzes how images have become the center of our digital social lives. Everybody seems to have the need or the passion (or both) for sharing visual evidence of their lives. Of course technology makes this kind of sharing easy and accessible, but I would love to understand more from an anthropological and sociological perspective about the reasons of such incredible trend. Read more…
Why is Pinterest so addictive? #infographic
I admit it, I’m getting addicted to Pinterest (these are our boards). If you feel the same or, better, if you’re trying to take advantage from a marketing POV of people’s addiction to Pinterest, then you should check out this infographic that the guys at Flowtown recently put together. Read more…
A Day in The Internet [infographic]
One of the most interesting & shared infographic that we posted last year pictured in a snapshot what happens on the Internet every sixty seconds. Today we post a similar kind of statistical overview, an infographic that recaps a day in the internet. From media consumption to social media, these numbers probably might not surprise us too much but will surely prove quite fascinating to review. Read more…
Interesting facts about Pinterest [infographic]
We’ve taken a break from infographic for some time. But today is appropriate to come back to share an interesting visual recap of the key facts about Pinterest users. No big revelations, but it’s definitely a good reference (as usual) to sound smart and up to date during your presentation to the clients Read more…
Popular posts
Tags
adidas advergame advergames advertainment advertising ambient marketing australia belgium best brazil coca-cola email marketing facebook fashion france germany google heineken ikea infographic italy japan marketing mobile content mobile marketing msn nike nokia online ads online advertising online campaign online marketing print advertising rich media samsung sms spain sweden tvc twitter uk video of the day viral marketing volkswagen wieden + kennedy
